Data Collection Methods
Cell Phone Usage In Class-
In order to log the amount of cell phones used in a singular class period, a running log of tallies was kept twice a week.
Assignment Completion-
The collection of assignments that were completed was kept in the grade book program
provided by the school district. The assignments were separated in the grade book by the
category in which the assignment fell.
Assignment Grades-
The recording of assignment grades were kept in the grade book program
provided by the school district. The assignments were separated in the
grade book by the category in which the assignment fell. The assignments
were graded on a 1-4 scale based on the amount of learning the student
portrays on the assignment.
Student Testimony-
Students were given a post unit survey in which they were asked about their opinions on
the choice novel unit. The students were asked the questions of the survey by an
impartial participant and was recorded by this individual as well.
Ensuring Accuracy/Triangulation
The different methods in which the data was collected was designed in order to ensure that the data being collected was accurate and reliable. The running records being recorded for all three points of data show that the data collected was gathered in an atmosphere and under the same conditions as each other data point. For example, the data collected for cell phone use in week two demonstrates why the results for assignment completion and assignment grades resulted as they did. In other words, the data collected on cell phone use is the cause that leads to the effect of the amount of assignments turned in and the grades received on these assignments.
The anecdotal notes works similarly with the student testimonies provided. These give us qualitative data (or perceptions) of those involved in the unit. This data also correlates that views of the teacher as a comparison to the views of the students. After all, students might not enjoy an assignment that a teacher would view as engaging. These testimonies and anecdotes can then be woven into the other data and be used as a point of explanation as to why the quantitative data shows what it does. It provides an explanation from the people who experienced the unit first hand and allows them to explain why so many assignments might not have been turned in and why grades were so low.
The anecdotal notes works similarly with the student testimonies provided. These give us qualitative data (or perceptions) of those involved in the unit. This data also correlates that views of the teacher as a comparison to the views of the students. After all, students might not enjoy an assignment that a teacher would view as engaging. These testimonies and anecdotes can then be woven into the other data and be used as a point of explanation as to why the quantitative data shows what it does. It provides an explanation from the people who experienced the unit first hand and allows them to explain why so many assignments might not have been turned in and why grades were so low.
Cell Phone Usage In Class
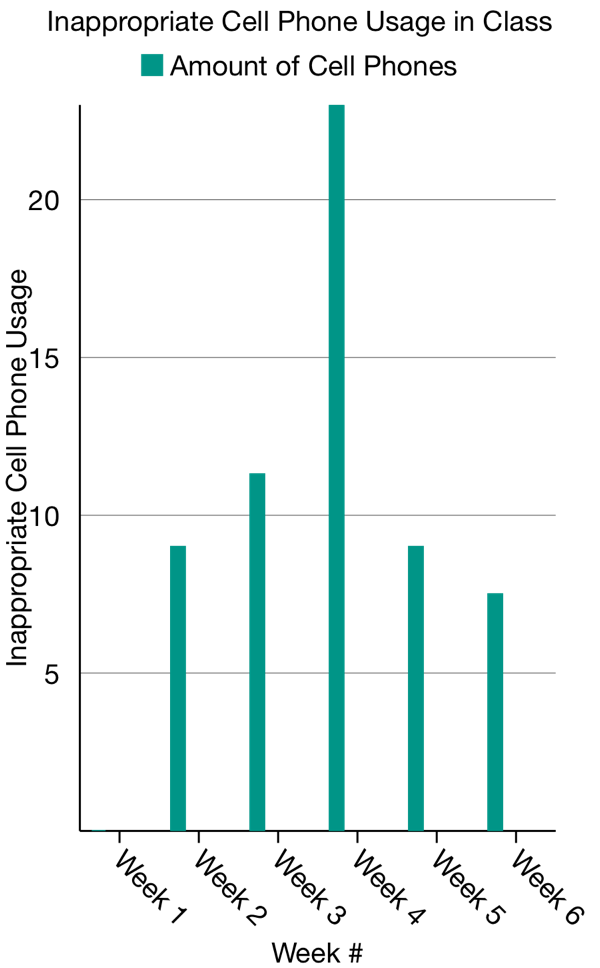
The first week of data collection showed no results because this was the week in which the students were learning about the unit. In this week, they received their packets, brainstormed about the kind of novel they wanted to read, and spent a day at the library choosing their novel to read. In this week, the students also set up their reading schedule that they would follow through the duration of the unit.
The amount of cellphones increased as the unit progresses into week 2 and then drastically jumps to 23 cell phones being used at some point in a class session during week three. This could be the result of the wearing off of the novelty effect. Essentially, the unit is no longer new and students became used to the procedures that are incorporated into the lesson. This result in comfort could explain the drastic increase of cell phones used in class.
The decrease in the amount of cell phone use could be the result of students attempting to catch up on missing work as the unit comes to an end. Further, the final week of the unit had students working on choice projects over their unit. These were considered summative assignments and are typically seen of greater value to the students. Therefore, it is probable that the students were concentrating on these assignments because they have a greater effect on their grade.
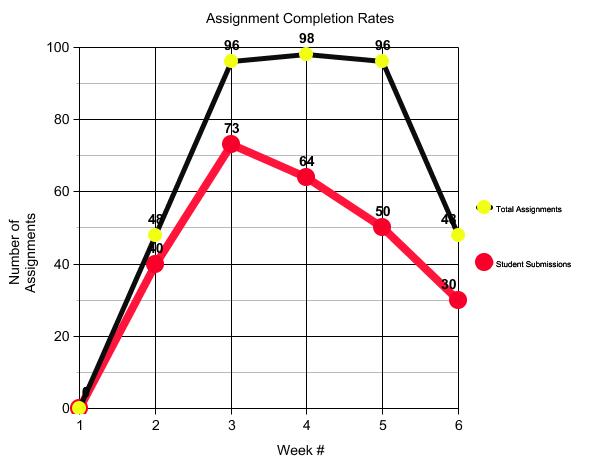
Assignment Completion
This first graph shows two separate lines that signify the amounts of assignments that were expected to be turned in and the amounts that students turned in. Data for these assignments were collected at the end of each week. The black line with the yellow dots shows the amount of assignments each week that the class was expected to complete. The red line shows how many assignments were completed by the class participating in the study. This tells us that in the early weeks of the study, the students were more likely to complete their assignments. This can be the result of the novelty effect, in other words, the unit is still new to them so they are more likely to keep up with the assignments. However, as the study progressed into weeks 3 and 4 student completion rates seemed to fall well below the line of expected assignments. In accordance with the decrease in amount of assignments in weeks 5 and 6 the amount of assignments complete draws nearer to the amount of assignments that were expected to be completed. This could be because students tended to work to get their work done as the end of the unit was upcoming. As the study ended, 125 assignments went into the gradebook as missing which tells me that there was a minor impact on the student’s assignment completion rates.
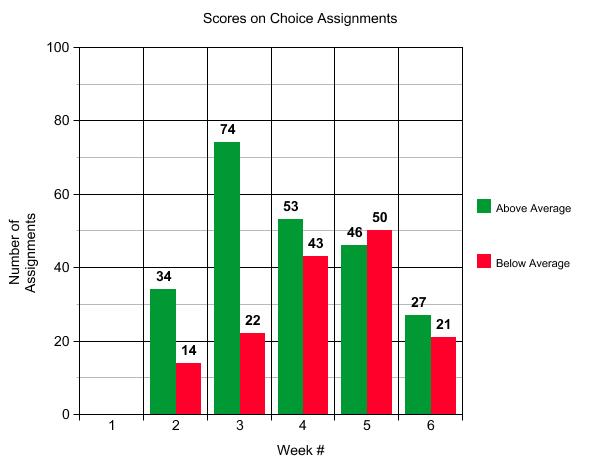
Assignment Grades
This graph shows the scores that students received for the assignments that they completed each week. As was noticed in the previous graph over assignment completion, more students received above average grades (meaning a 2.5-4.0) than those who received below average grades (0.00-2.00). Once again, this can be attributed to the idea that students were interested in a unit that is built around their own interests. However, the amount of below average grades that students receive dramatically increases when the study reaches week 4. It should be noted that the first week has no data because the graded assignments did not begin until week two of the study. Further, week 2 and 6 have less assignments than the data from weeks 3-5. It also should be known that assignments that go into the gradebook as missing are counted as zeros. In other words, the student fails the assignment but it is categorized as never turned in. Missing assignments were counted in the below average data and account for much of this same data. This data tells me that because the above average scores were not significantly higher and did not show a continual growth, that student impact on learning was not significant because of this unit.
Student Testimony
|
High Achieving Student Testimony |
| ||
|
Mid-Range Achieving Student Testimony |
| ||
|
Low Achieving Student Testimony |
| ||
The student conferences and testimonies was the most influential data that I took for this study. This data was recorded using prompting questions that were going to be asked to the students by my CADRE associate. I asked my CADRE associate to conduct these interviews to receive the most honest answers. The questions were designed specifically to ask students how engaged they felt during the unit, what parts of the unit they enjoyed, what parts they did not enjoy, and what they would change if they were to do this unit again. I chose this because I felt it would provide me with the student’s perspectives over the unit and would give me specifics over what part of the unit was well liked and disliked. Further, this demonstrates to me that the mini nine assignments were not rigorous enough for the students and thus were not deemed as valuable as an assignment such as the choice project. As a result, it did not have a significant impact on student learning. This could explain why almost a fifth of the mini nine assignments were not turned in and were recorded as missing.
